Investigate a slow checkout
The service map shows a relationship. A trace tells you where one request spent its time. This exercise takes you from an 842 ms checkout to a 710 ms database span and the log attached to that request. The dataset is synthetic: no purchase or SQL query is executed.
Prerequisites
- A running Avuru Obs installation with traces and the logs module enabled.
- A test project and its ingest key if ingest authentication is enforced.
- Python 3 and access to the gateway's OTLP/HTTP endpoint.
Use a test project: this exercise writes four spans and one log. It does not change application configuration. Follow installation if you do not have a receiver yet.
1. Send the example
Download slow-checkout.py. Inspect the
payload first; --dry-run sends nothing:
python3 slow-checkout.py --dry-run
For a Kubernetes install, keep this port-forward running in another terminal:
kubectl -n avuruobs port-forward svc/avuruobs-gateway 4318:4318
If your test project requires a key, set AVURU_INGEST_KEY in your shell. The
script sends it as a bearer header and does not print it. Then run:
python3 slow-checkout.py --endpoint http://127.0.0.1:4318
Keep the printed trace ID. The receiver accepting the payload is the first check; storage and visibility in the UI are the next checks.
2. Find the relationship
Open Service map, select the receiving project and the last 15 minutes.
Look for atlas-checkout → atlas-payment → postgresql://atlas-orders-db.
The database is inferred from the payment service's client span: it has no
server spans of its own. Allow the map's aggregation to refresh. With one
request, a percentile is not a meaningful performance baseline.
The production map uses the telemetry it receives. Its appearance can differ from the simplified interactive illustration on the landing page.
3. Read the trace, not just the total
Open the checkout's traces and select the printed trace ID. If the map has not
refreshed yet, search directly in Traces for service atlas-checkout.
| Span | Duration | Interpretation |
|---|---|---|
POST /checkout | 842 ms | Total server request |
| Checkout → payment client call | 790 ms | Caller-observed downstream duration |
| Payment server span | 770 ms | Work observed inside payment |
SELECT orders | 710 ms | Database client operation inside payment |
These spans are nested. Do not add their durations together. The client call can include transport and other overhead beyond the server's own span. The database operation accounts for most of this example's delay, but the span alone does not prove a missing index, lock or overloaded database.
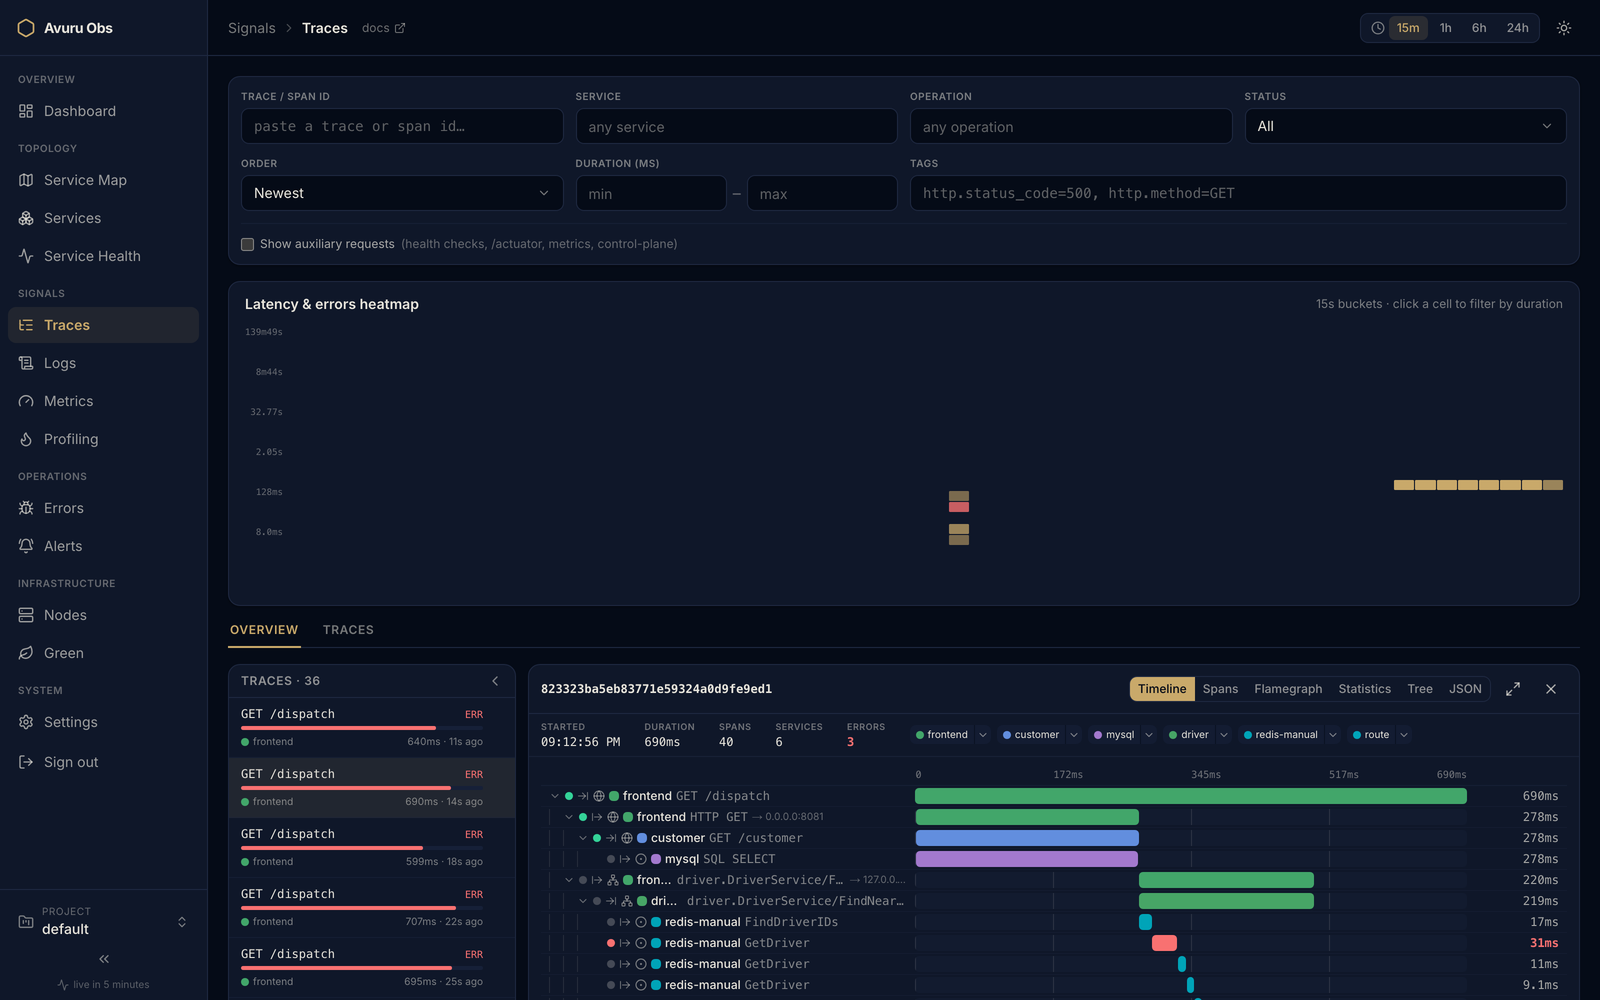
Product screenshot; the services and values shown differ from this exercise.
4. Follow the correlated log
Open the trace's logs or find the record for atlas-payment in Logs. It
carries the same trace ID and the payment span ID. The message explicitly
identifies the synthetic example.
A missing log is not proof that no event occurred. Check the logs module, project, time window and trace ID. An ordinary stdout line without a trace ID can still be searched, but cannot be joined to this request automatically. See trace/log correlation.
5. Decide what to investigate next
On a real incident, compare another request, check the service's RED metrics and inspect database evidence before changing anything. A single slow trace is evidence of one slow request, not proof of the cause of every slow request.
If the exercise fails:
- Connection refused: keep the gateway port-forward running and check the port.
- 401/403: use the receiving project's ingest key and check the gateway's ingest mode.
- Accepted but absent: check the project, timestamps, ingestion health and refresh window.
- Dependency missing: open the database client span and check
db.systemandserver.address.
For application-generated spans, continue with the Go example and PostgreSQL integration.